Case Study
Understanding Transit from a Rider's Perspective
The Kansas City Area Transportation Authority wanted to go beyond satisfaction scores and demographics to truly understand the rider experience.
Our team immersed ourselves in the system, listening to riders, stakeholders, and operators, and turning insights into tools like traits, archetypes, and journey maps.
This work provided KCATA with clear opportunities to simplify planning, improve reliability, and communicate the value of transit in a car-centric city.
CLIENT
Kansas City Area Transportation Authority
PROJECT TYPE
Experience research and analysis
INDUSTRY
Transportation, Government
SERVICES
Discovery and evaluation
Walking the system revealed where riders lose trust.
The research started in the field, not in a conference room. Riders were observed and interviewed across routes, stops, and trip-planning moments, catching friction in real time rather than reconstructing it from memory. What came back wasn't a usability problem with one app. It was a pattern of unmet expectations spread across every touchpoint the system owned.
Field Studies
The research team didn't observe riders from the outside. We became them. Each team member was handed an "Amazing Race" challenge: get to a real meeting, at a real place, by a real time, using whatever the system gave you.
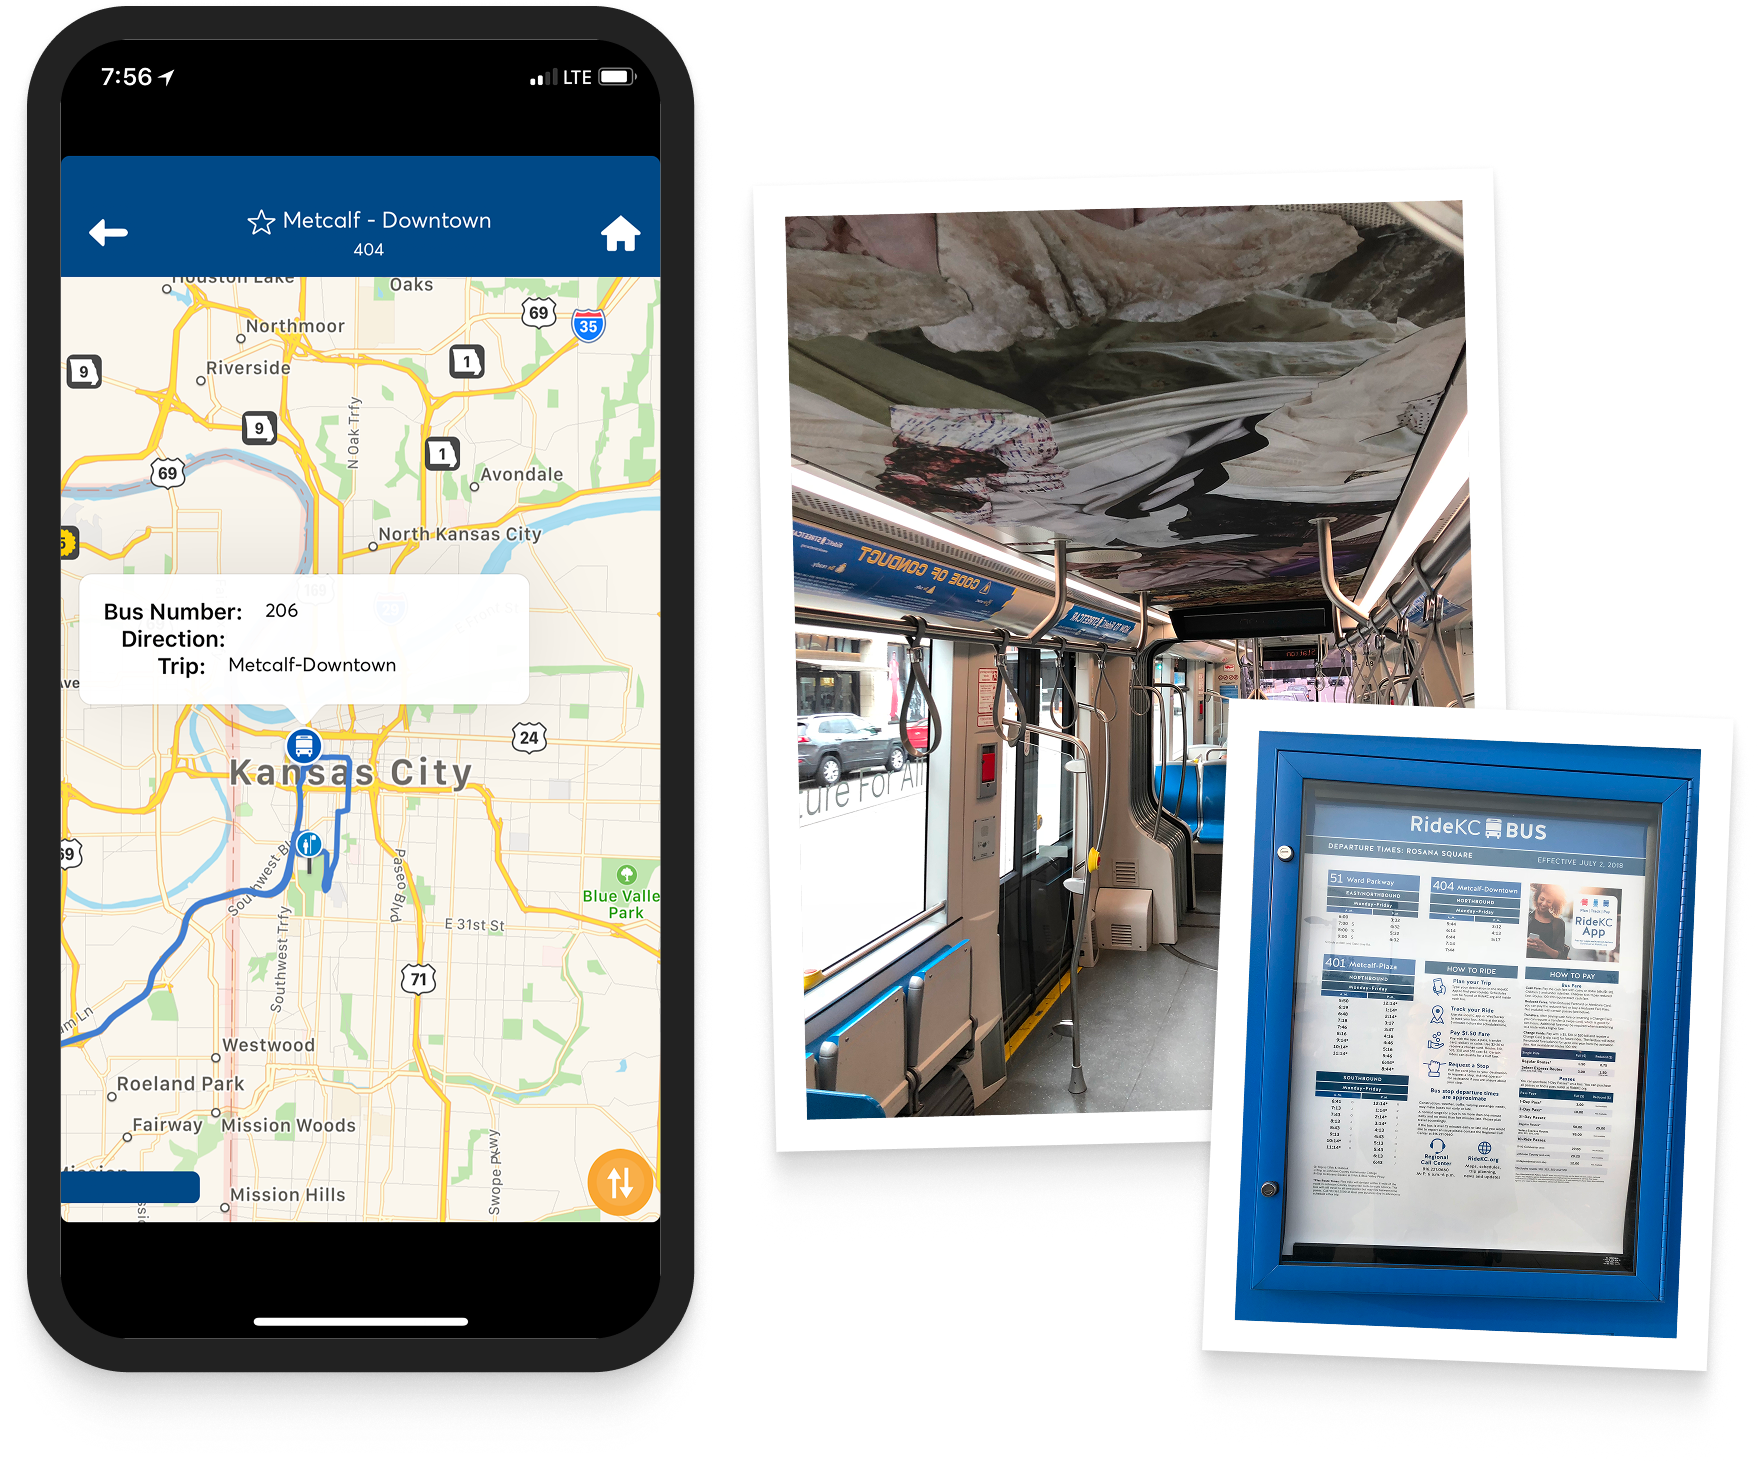
The four of us ran multiple routes across the city, logging every point of friction in real time. Tools that didn't talk to each other, schedules that assumed you already knew the route number, an app that only showed the next 10 departures and called it trip planning. The notes from those sessions were blunt. They shaped everything that followed.
Usage of the system exposed many negative aspects to overcome.
Digital and Physical Audit
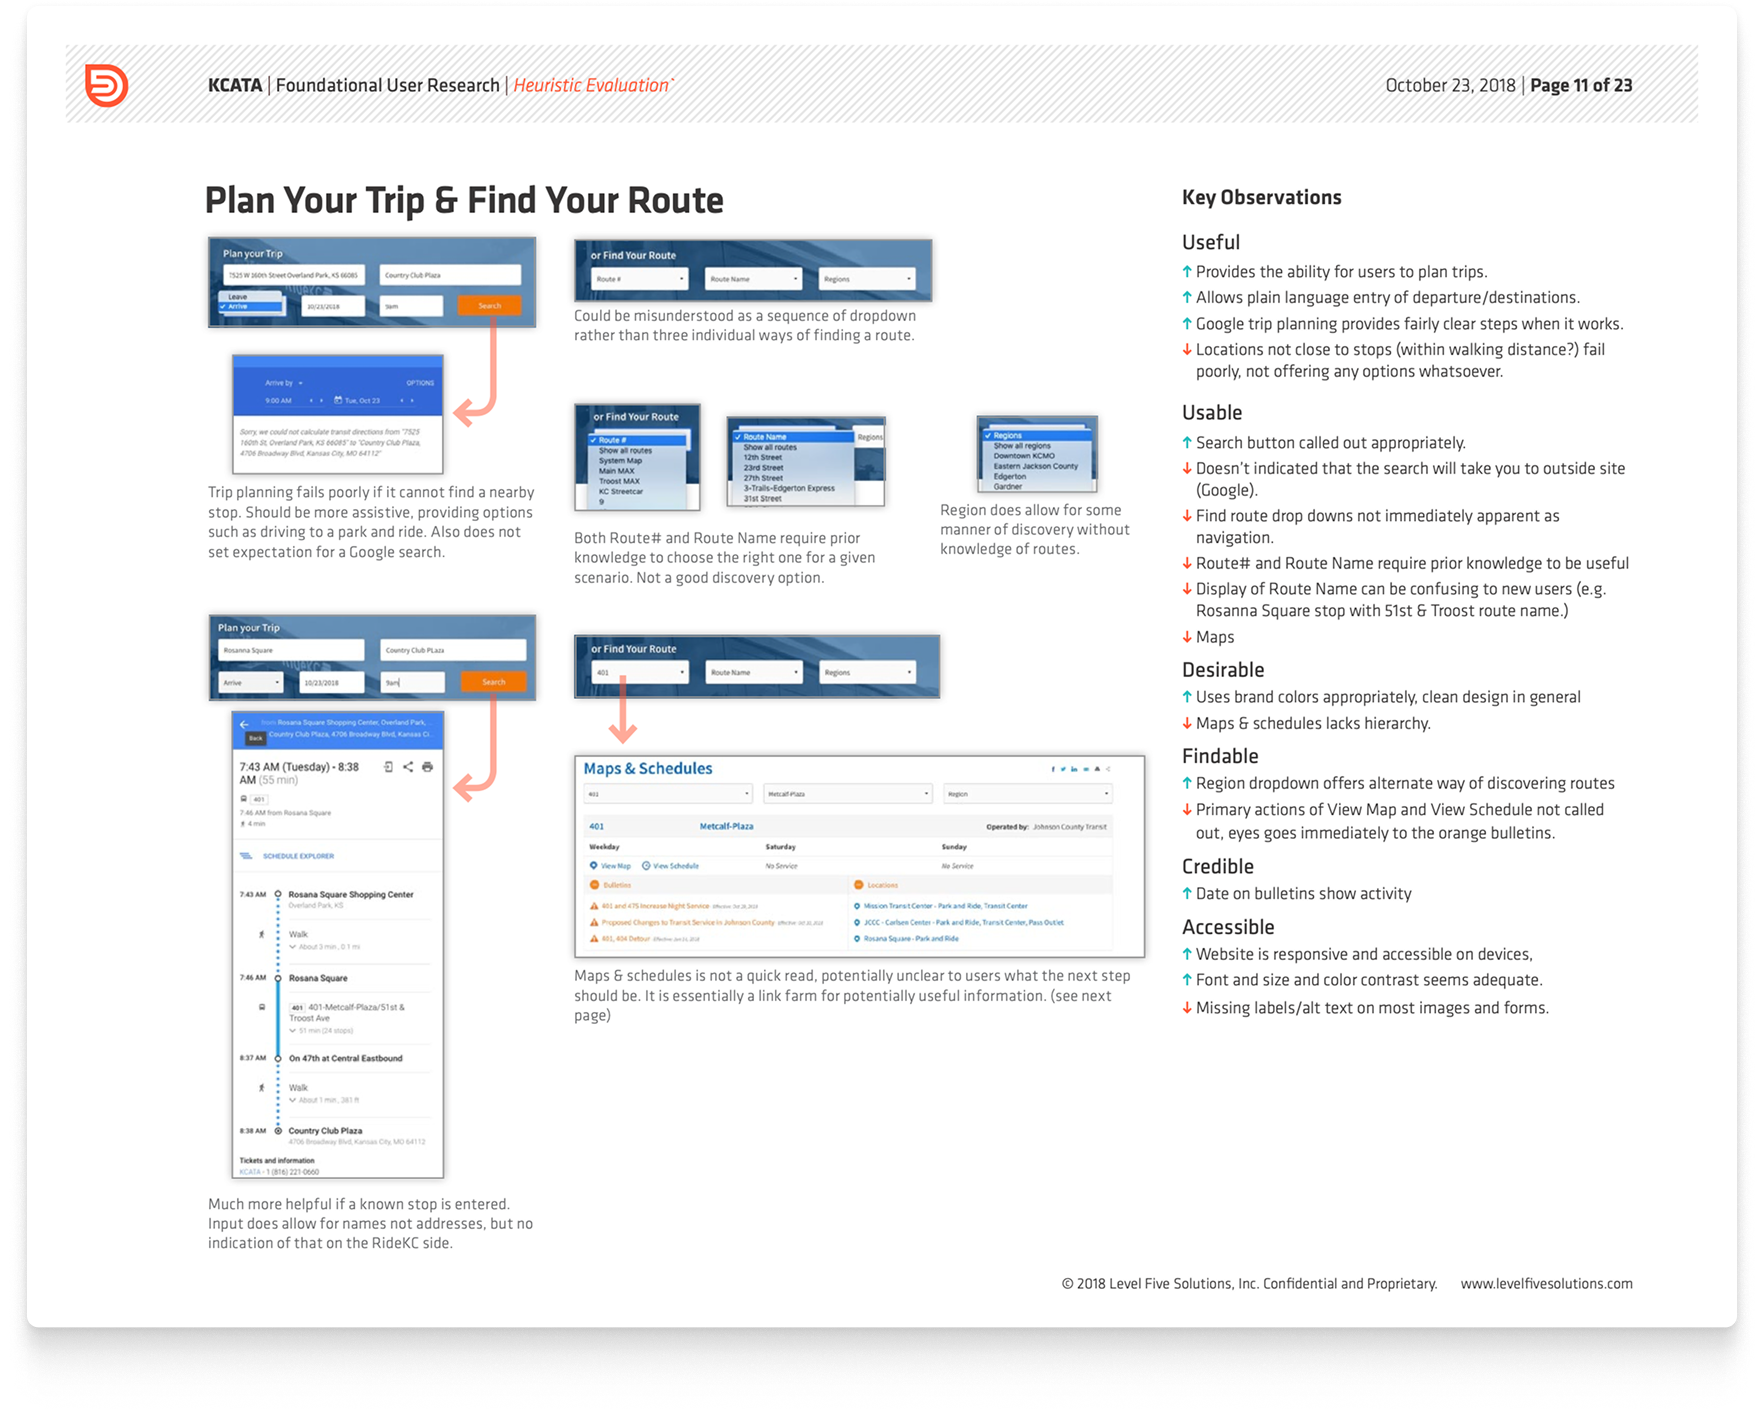
Before talking to a single rider, we audited everything a potential customer might touch — the RideKC app, trip planning tools, route schedule PDFs, the KCATA website, bus stop signage, printed schedules.
The Amazing Race runs had already flagged where things broke down in practice; this was the systematic version of that. What came back wasn't a list of UI bugs. It was a pattern. Every touchpoint assumed the rider already knew how the system worked. The tools weren't designed for someone trying to figure it out for the first time.
Initial trip planning is a barrier to first-time transit riders.
Rider journey & experience map
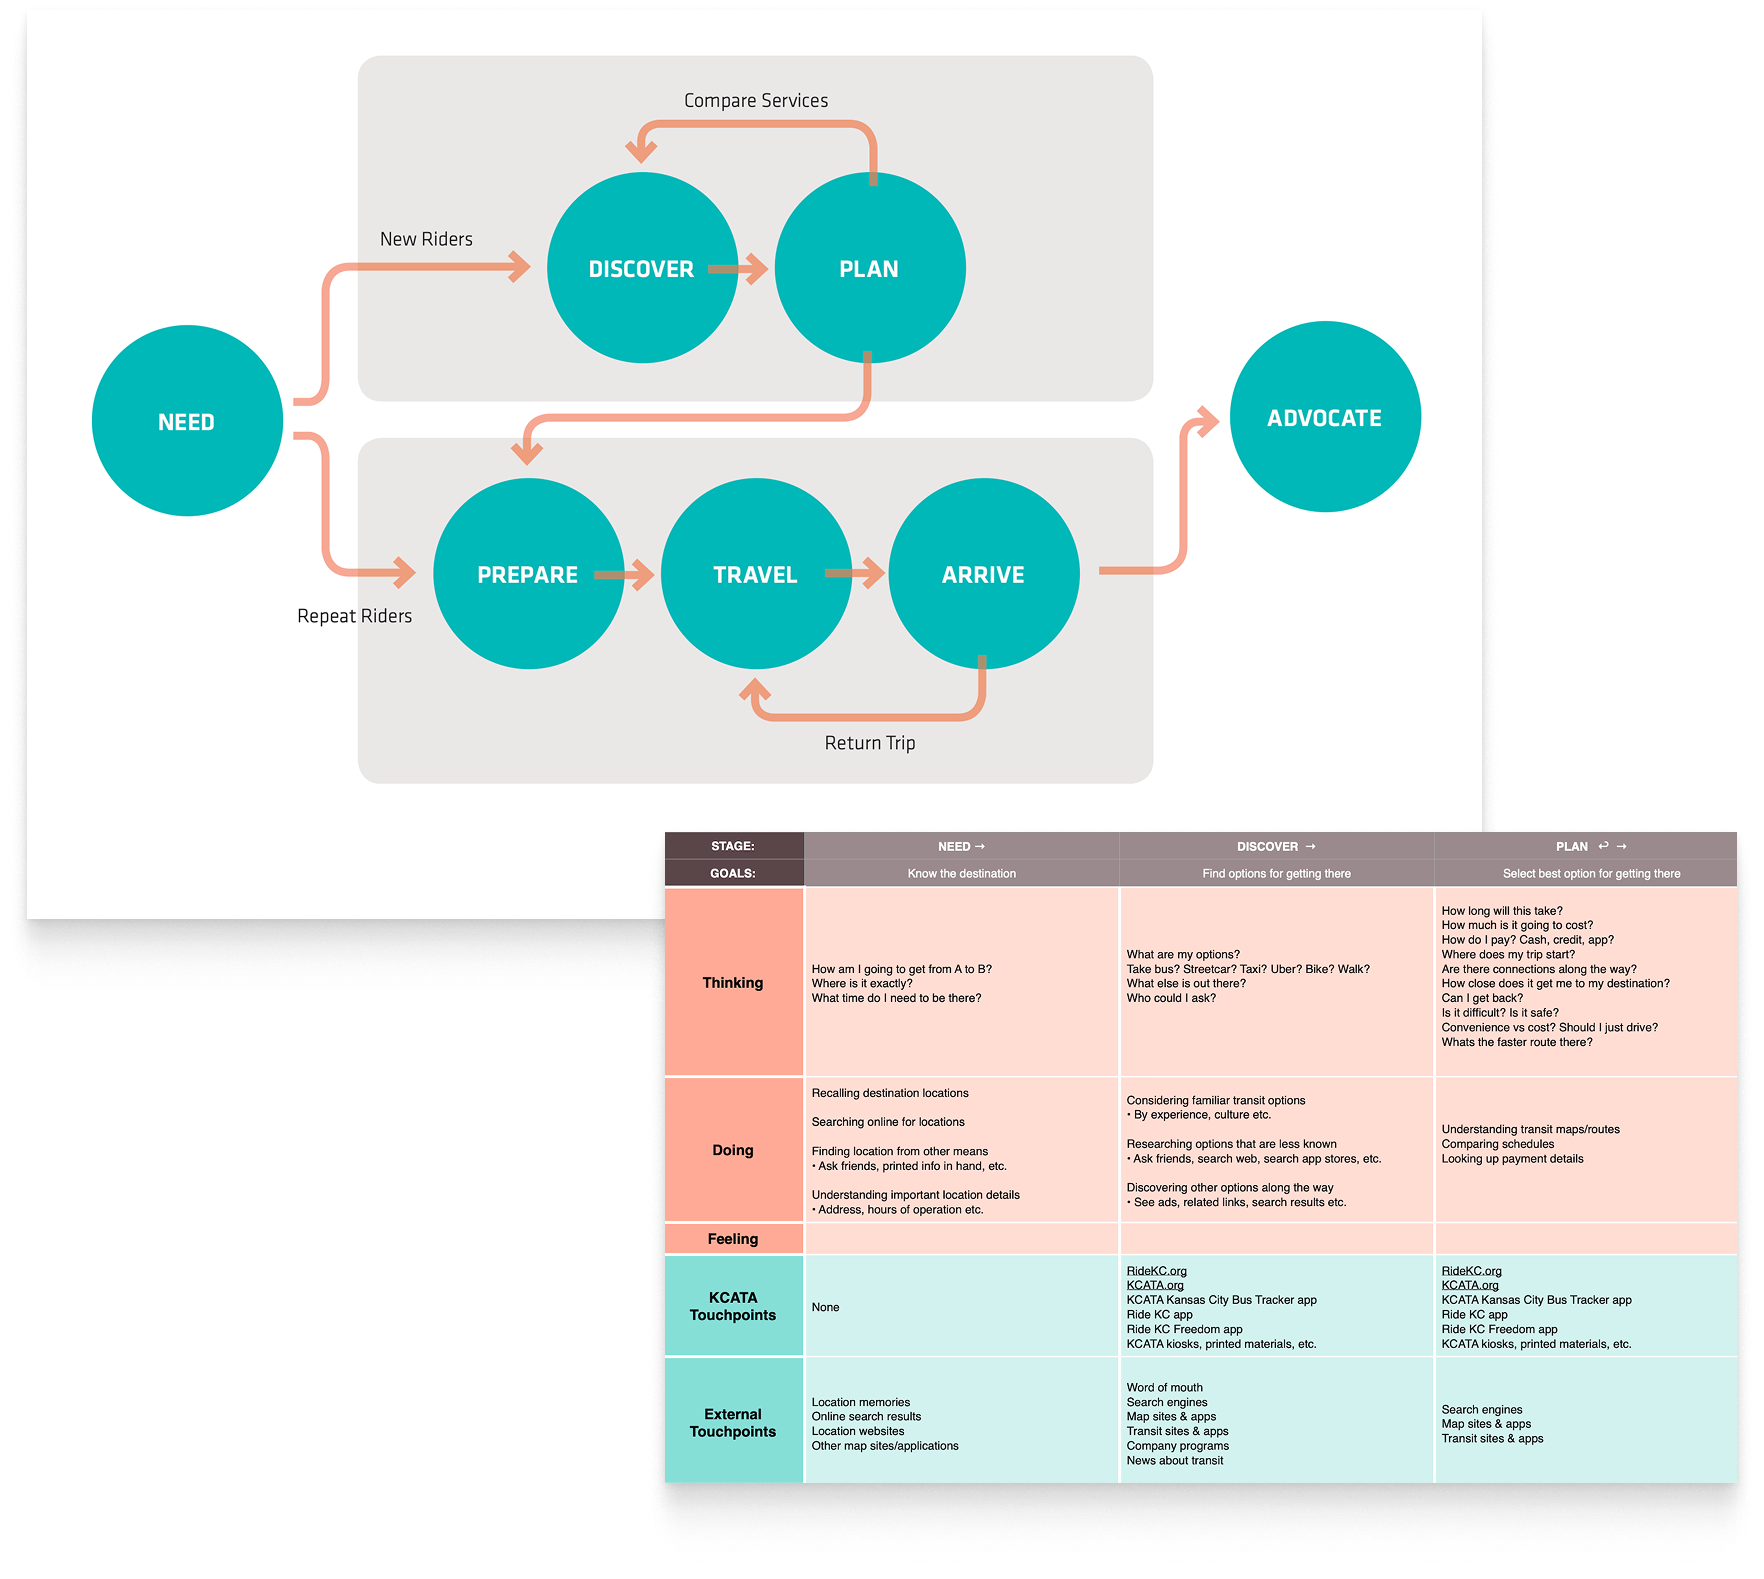
The journey map revealed a clean behavioral split. Frequent riders had internalized their routes. If the 7:30 bus always shows up, you stop checking. That works until something breaks, and then they have no fallback. Not because they forgot how to use the tools, but because the tools weren't good enough to bother learning.
New riders had the opposite problem. Too many tools, none helpful enough to build confidence. The empathy mapping layer made the opportunity obvious. The system was failing both groups, just at different moments.
Frequent riders became less reliant on planning tools.
Interviews and surveys
Transit connects to more than rides. It shapes work, health, and community life.
Field observation captured behavior. Interviews and surveys captured the stakes. Riders across income levels, employment situations, and neighborhoods were recruited through transit agencies, social service organizations, and community partners. What surfaced wasn't just friction with the app. It was how much transit dependency shaped the rest of daily life, and how much local institutions shaped whether people trusted the system at all.
Stakeholder Interviews
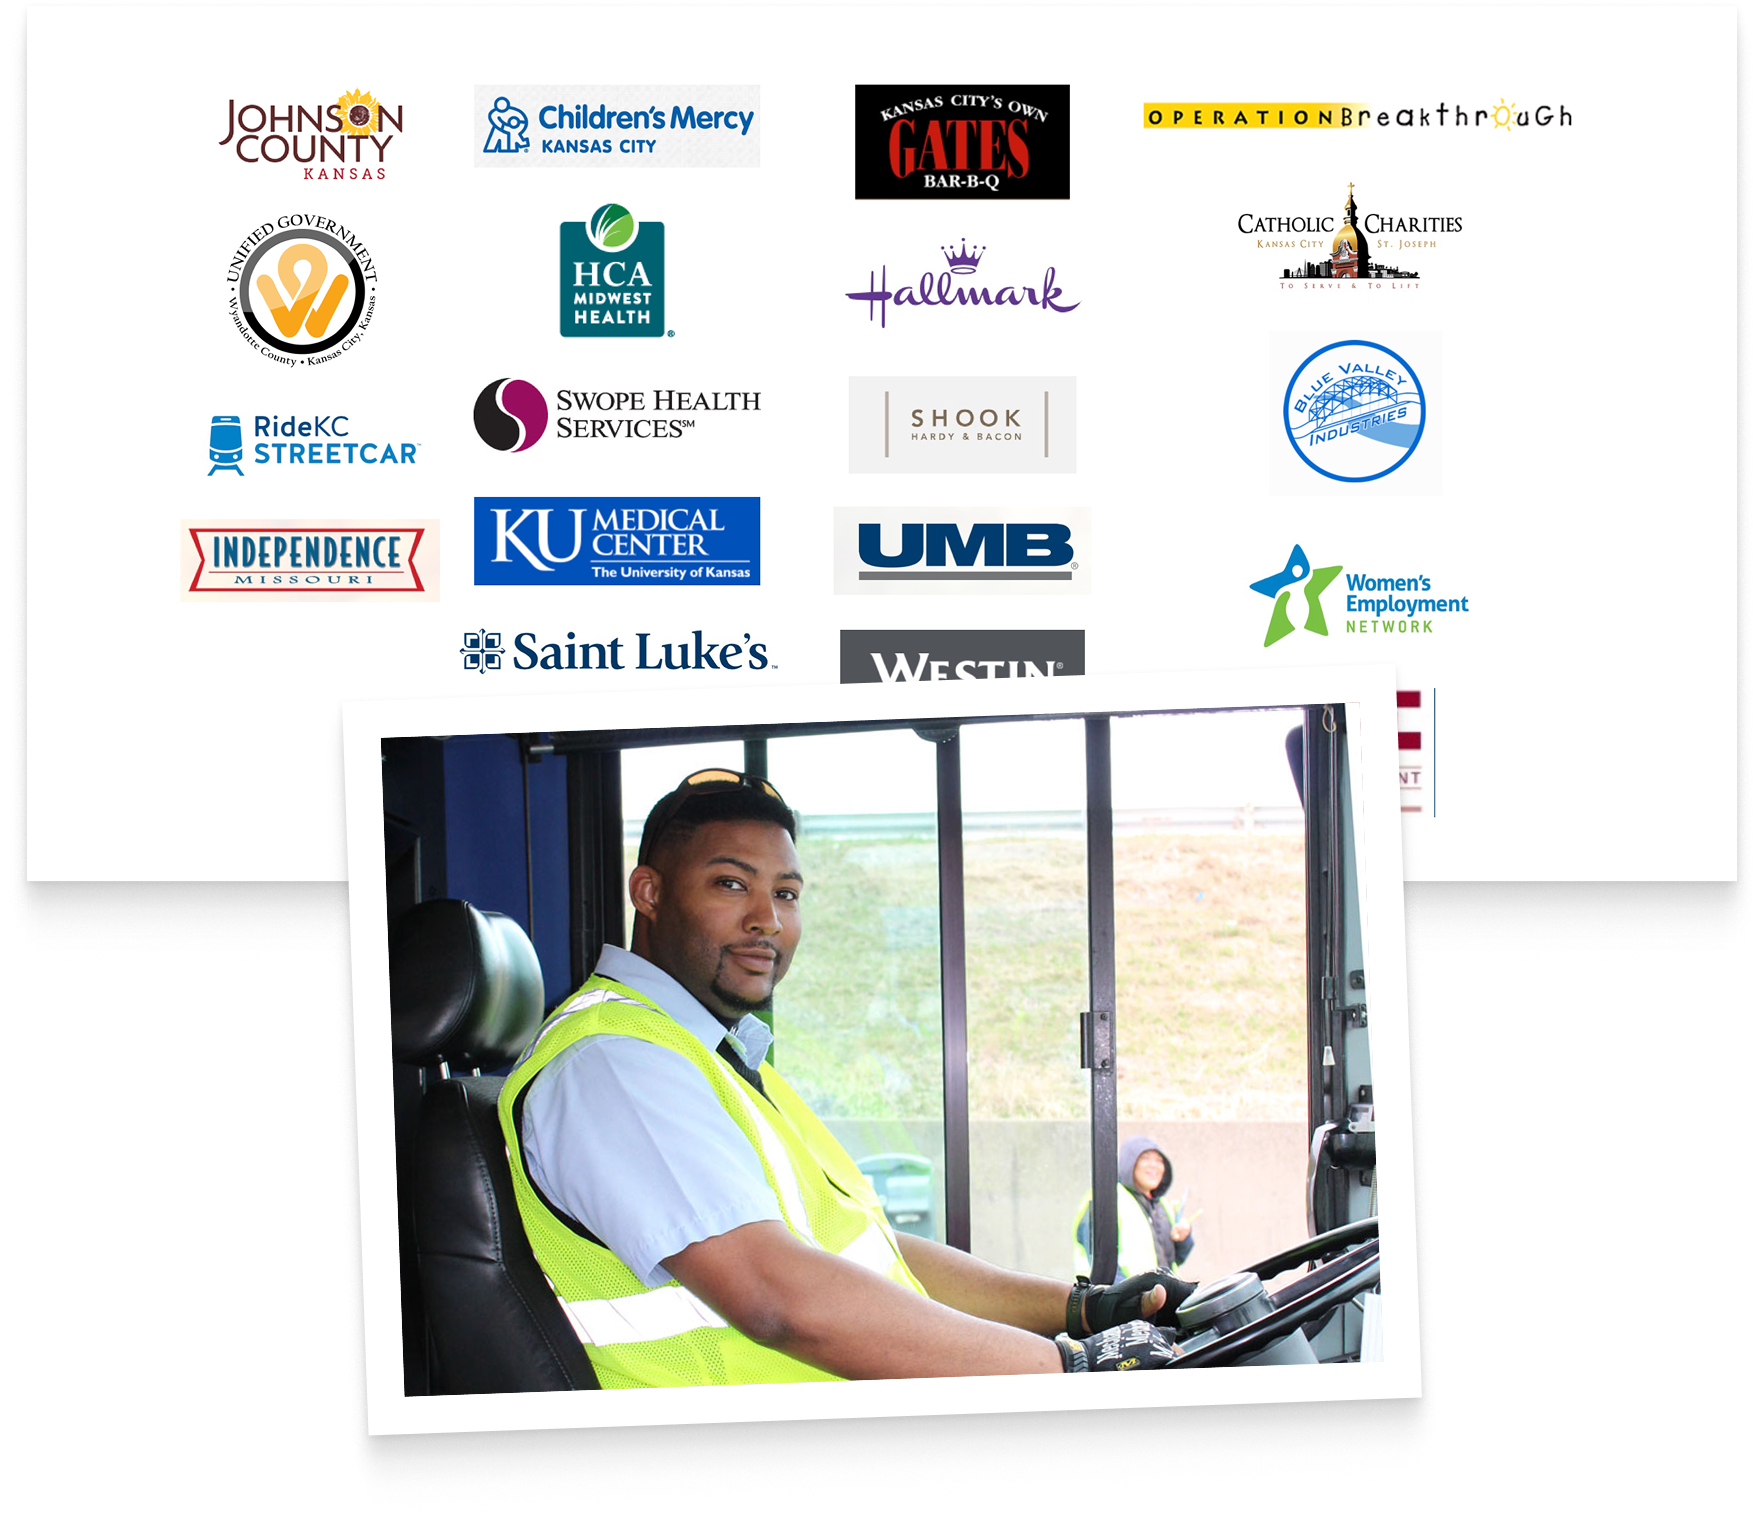
Interviews ran across a wide cross-section of organizations that touched transit in some way: employers, developers, social service agencies, healthcare providers, property managers. Transit wasn't part of anyone's strategic thinking. Every developer we spoke to said it wasn't in their planning process. Employers offering subsidies had program managers who didn't understand what the benefit was worth. Employment agencies needed routes to get workers to jobs, employers needed those workers, but the conversation between them wasn't happening.
No one was connecting the dots — and everyone assumed someone else was.
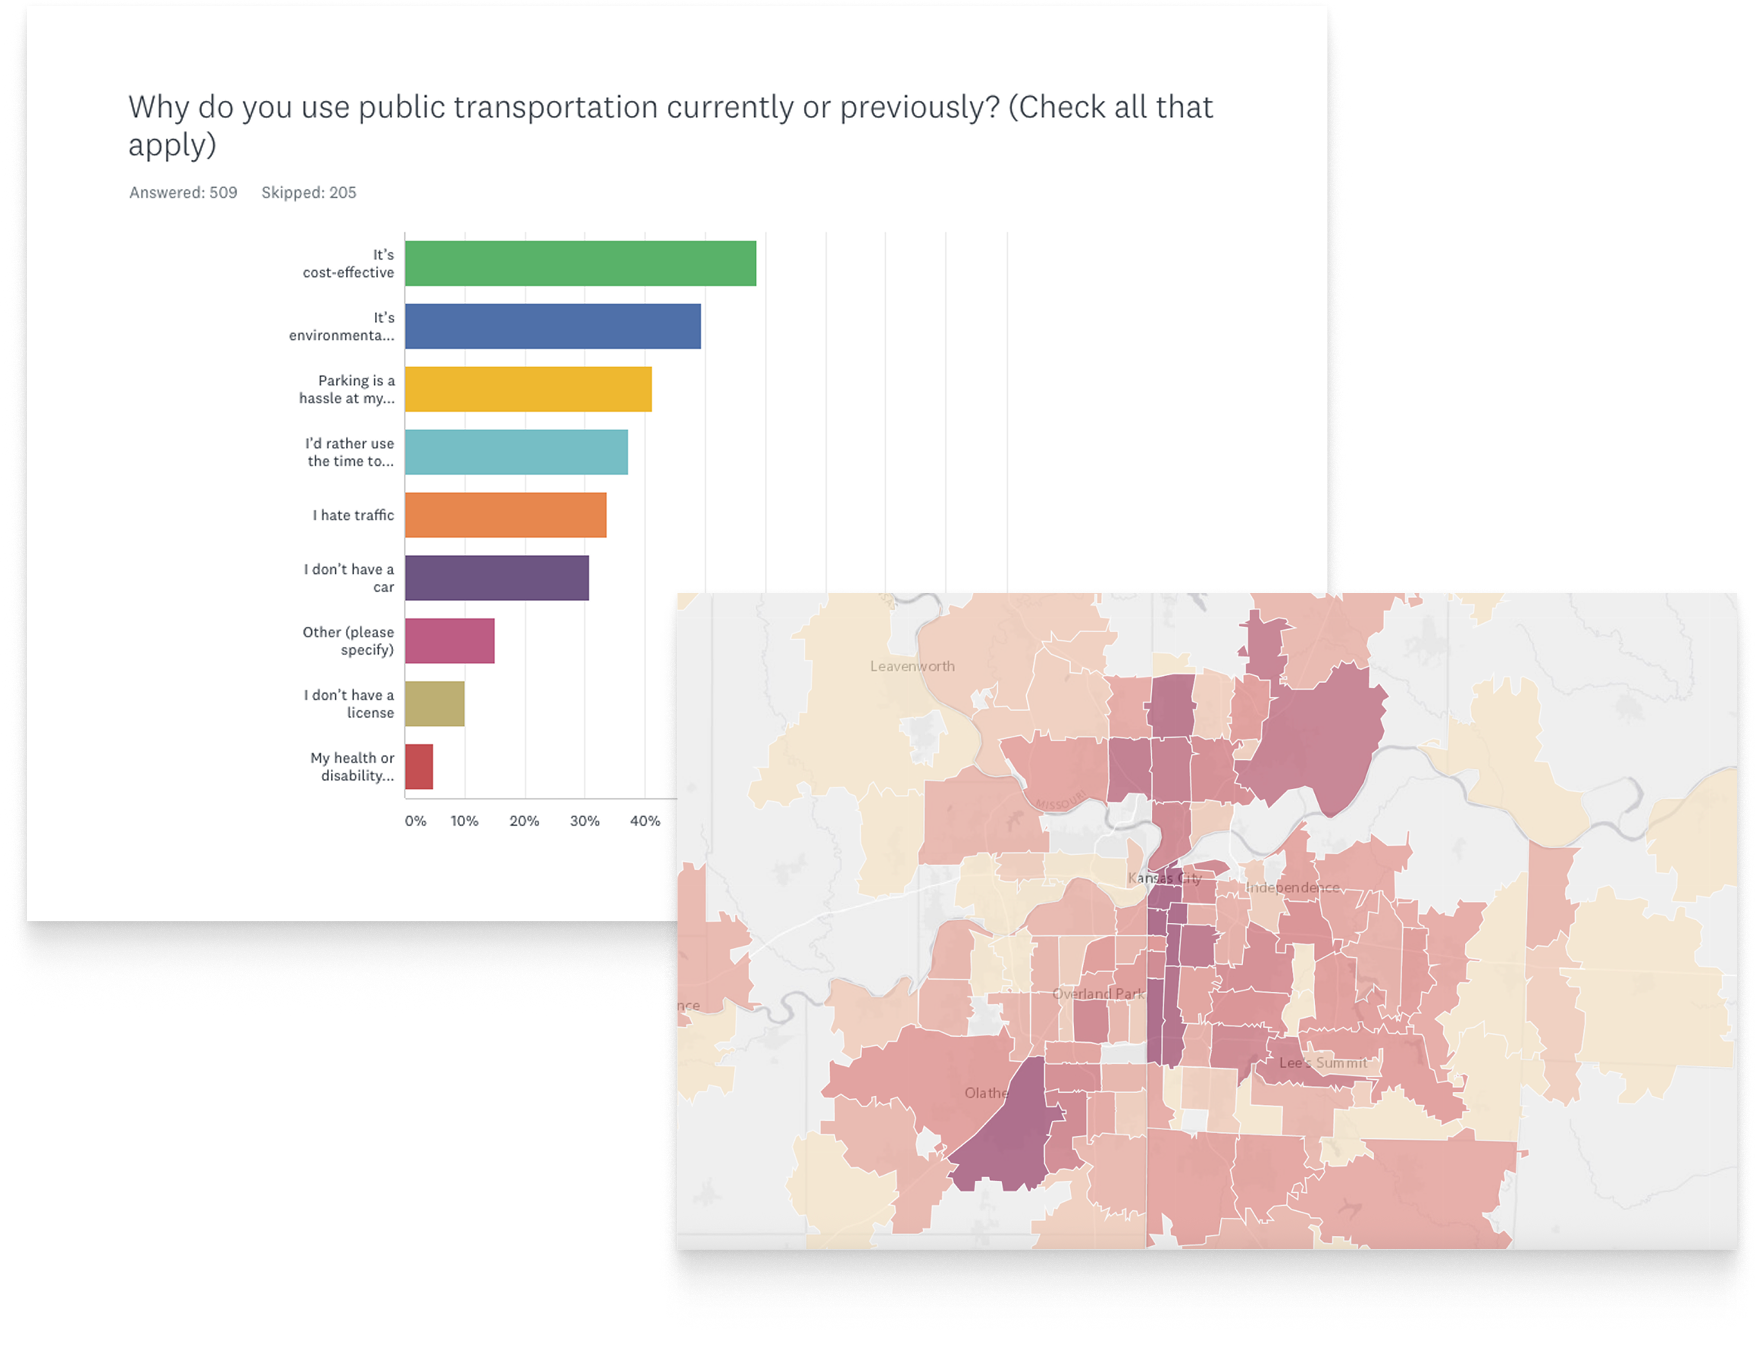
Rider research
The survey ran wide — over 600 respondents across current riders, former riders, and people who'd never taken a bus. The split was stark: roughly 40% rode daily, 40% had never ridden at all, with almost nothing in between. And yet 70% said they thought transit was a good thing for the city. The problem wasn't perception, it was friction. People quit riding because they got a car, because the route times didn't work, because the stop was too far. And they felt less safe waiting at the stop than they did on the bus itself.
“The app doesn't always match reality, so I check Facebook to see what's really happening.”
— Daily Rider
Traits and archetypes
Riders weren't just simple demographics — their traits showed real complexity.
The research produced more than a persona set. It built a flexible framework that could slice a large, diverse ridership any way a design or service problem demanded — by motivation, by route complexity, by transit knowledge, by the issues they were likely to hit. That framework became a shared tool across the organization.
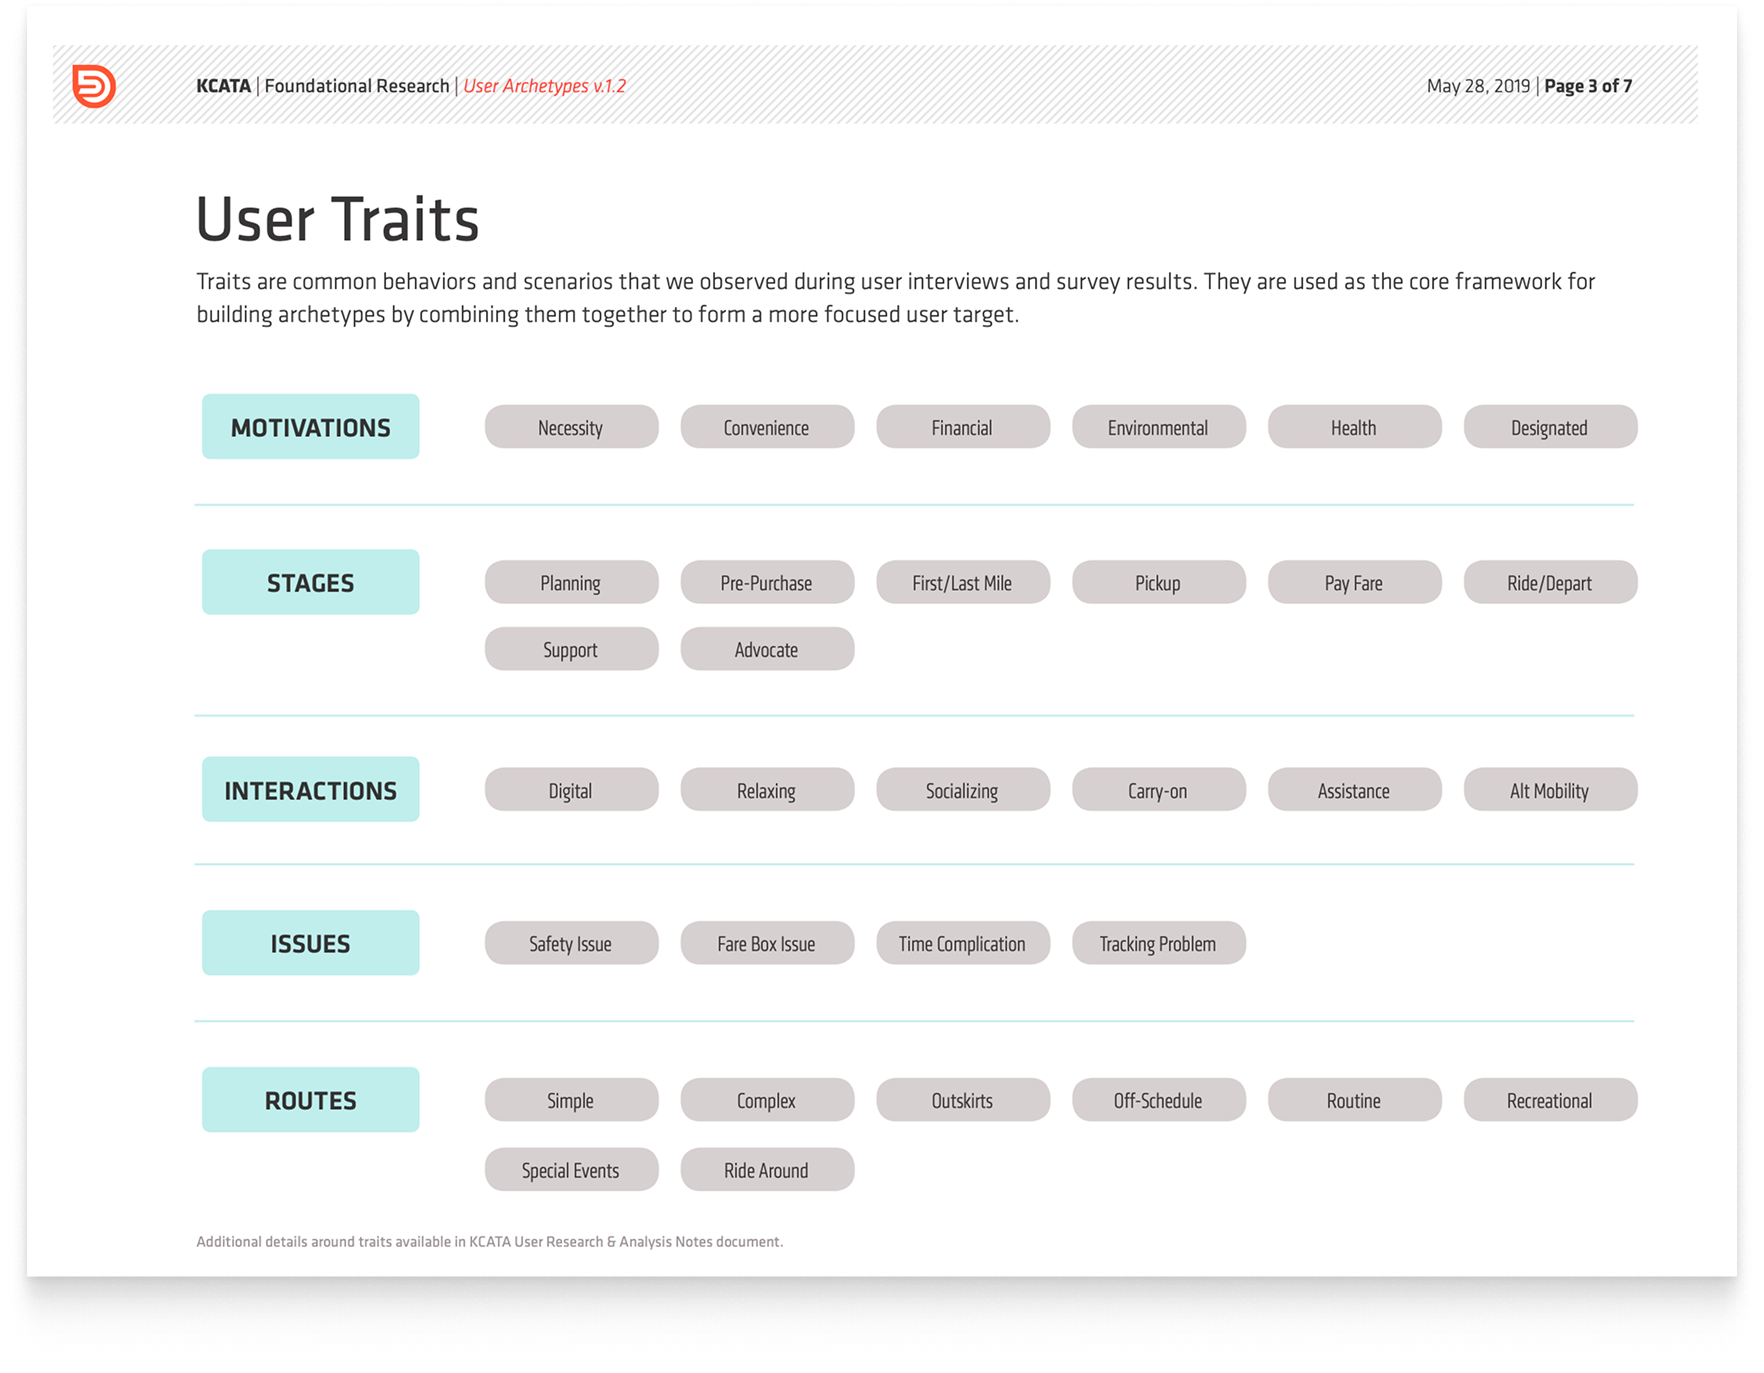
User trait system
The traits matrix pulled together behavioral patterns from interviews and surveys — motivations, route complexity, interaction styles, common issues. The value wasn't in any single trait, it was in combination. Stack the right ones together and a real rider type emerges. It gave KCATA a common language for their riders — and a flexible framework for building archetypes that reflected how people actually used the system.
A shared trait framework lets you slice a large, diverse ridership any way the problem demands.
Riders with a purpose
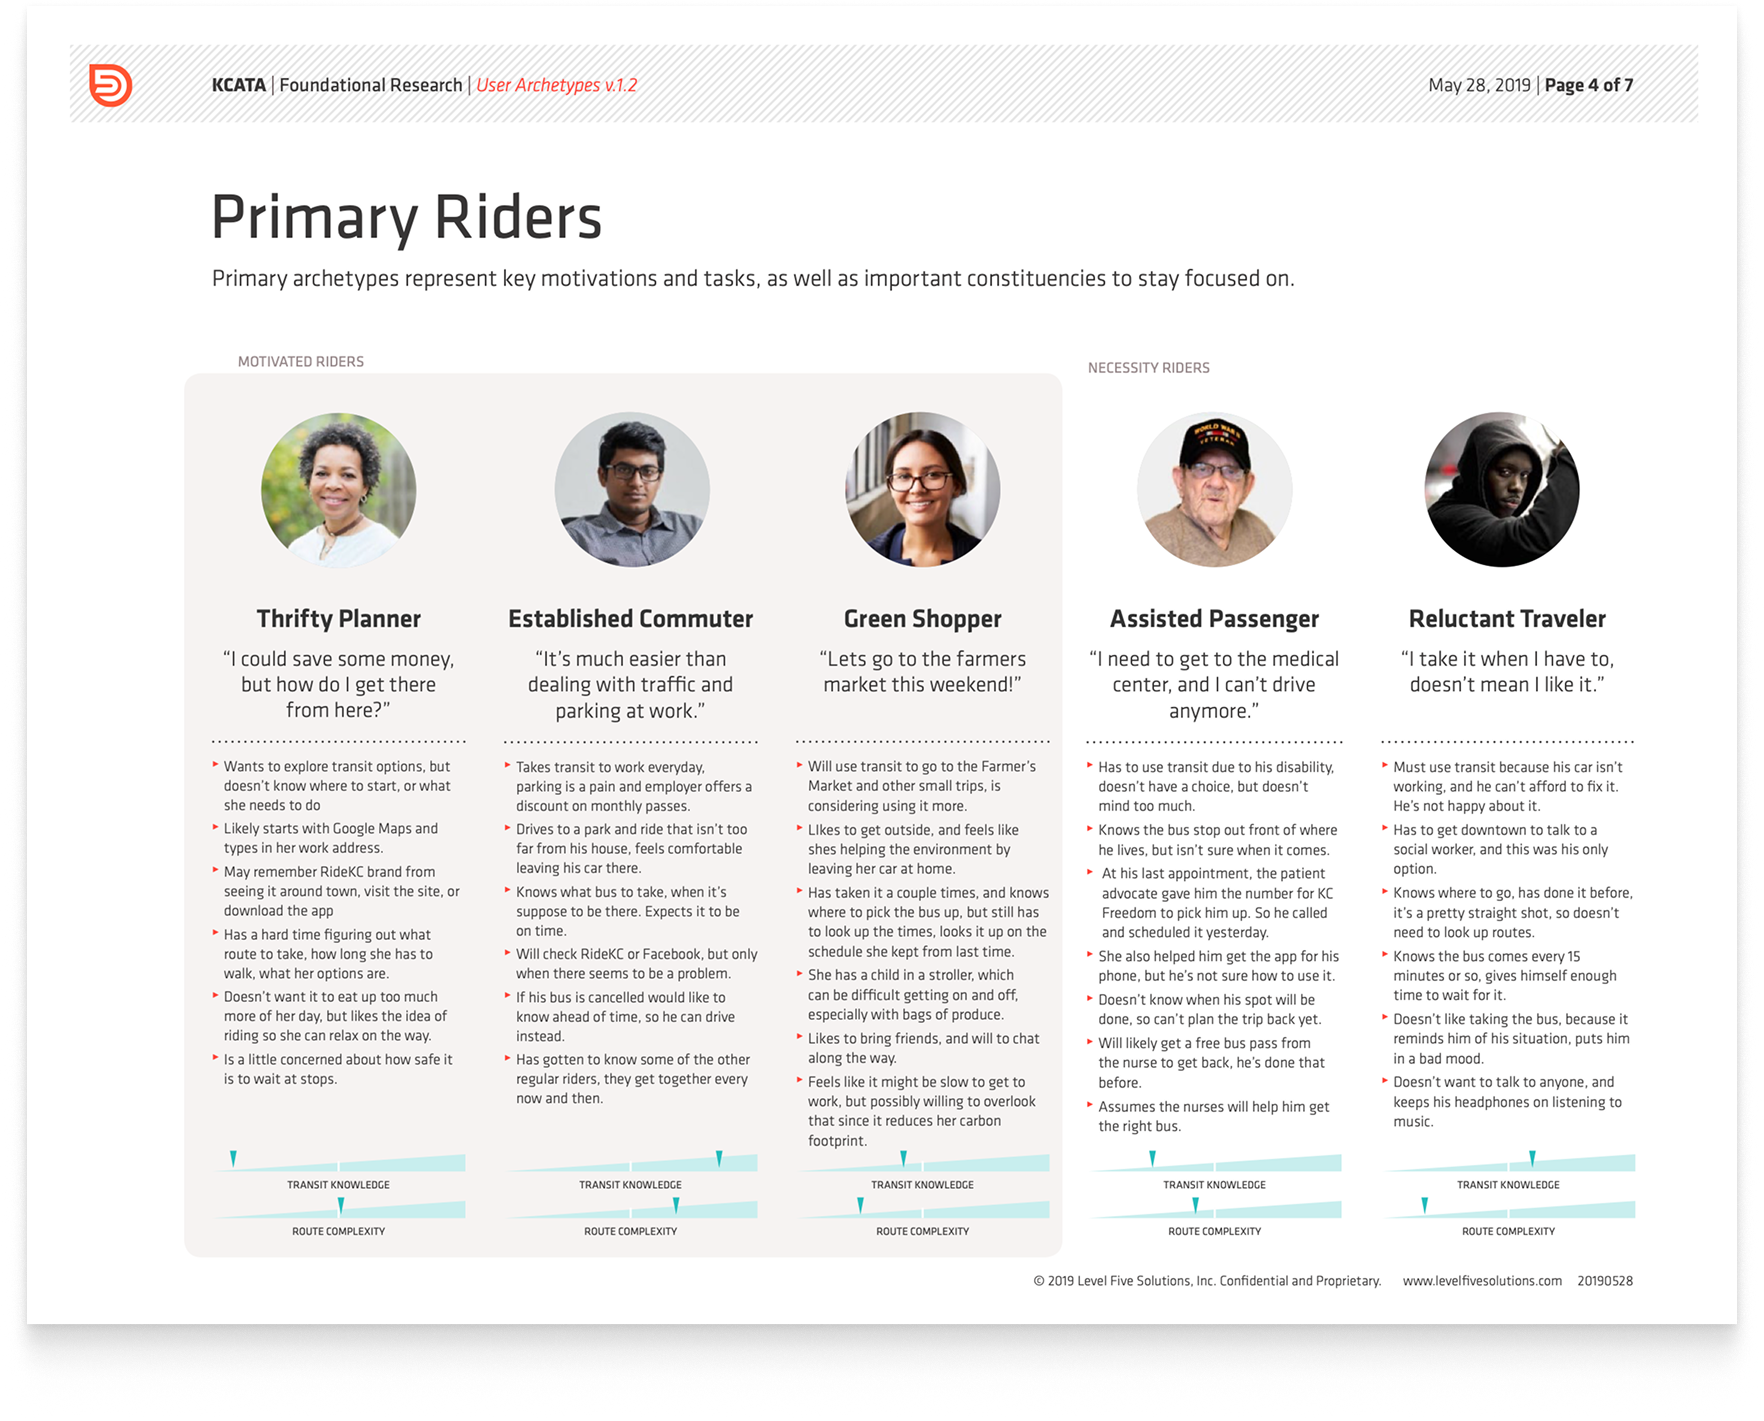
Five primary riders, five secondary, plus disruptors, non-riders, and a full influencer ecosystem: employers, developers, patient advocates, transit partners. The motivated/necessity split was about more than why people rode — it was about how they felt doing it.
A Green Shopper taking the bus to the farmers market is in a completely different headspace than someone who has no car and no other option. Same bus, very different experience.
These profiles give KCATA a practical tool to better align their services and messaging to rider needs
Insights to action
The research revealed opportunities to rebuild trust and add value to ridership.
The findings were packaged into a series of presentations and reports delivered to KCATA's executive leadership and board of commissioners. The recommendations tied directly back to the behavioral patterns in the data: what riders needed, when they needed it, and what would actually earn their trust.
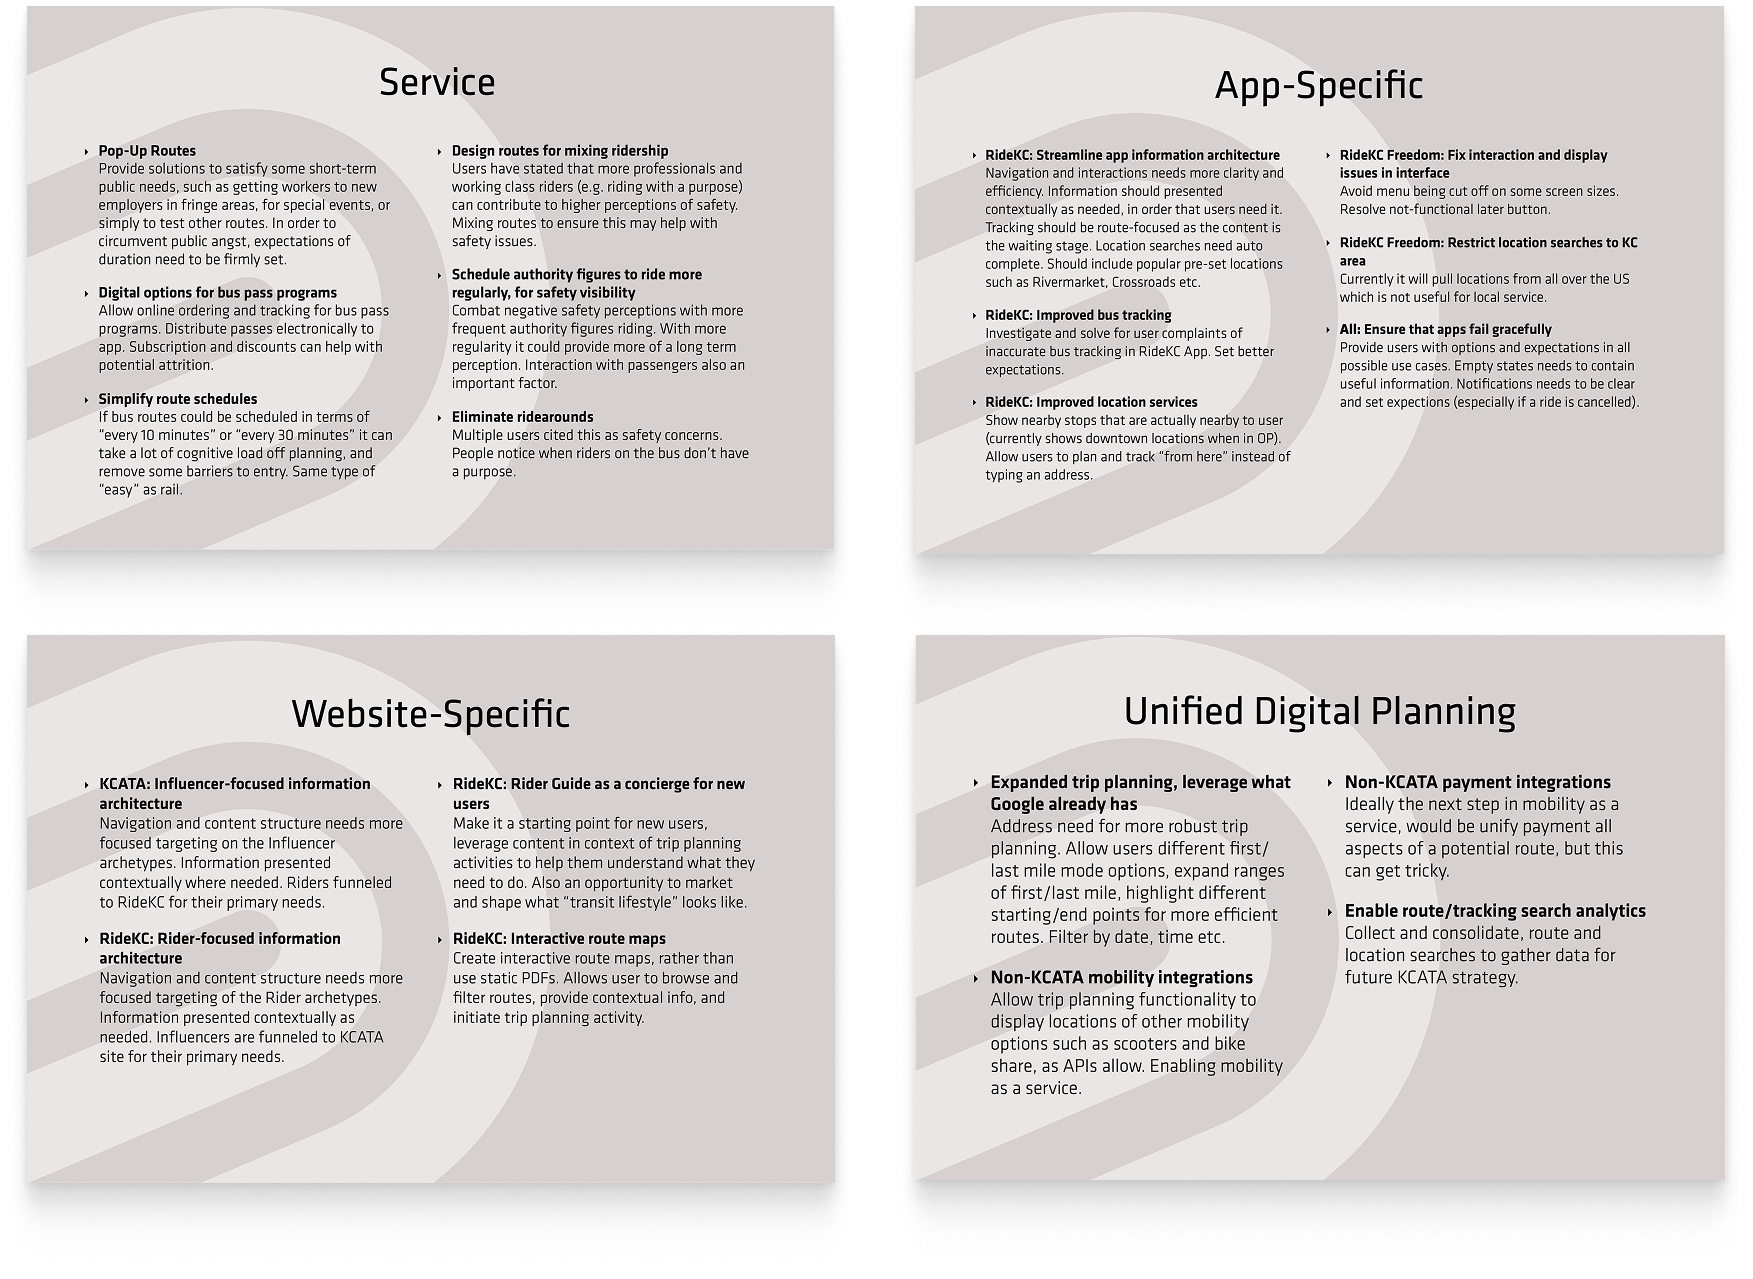
Opportunties & recommendations
The roadmap spanned service design, app fixes, website improvements, and a unified digital planning vision. Some were tactical — better bus tracking, interactive route maps, smarter location services. Others were bigger swings — pop-up routes for surging event demand, trip planning reimagined as a concierge for new riders, first/last mile options built into the planning flow. Design for the rider who doesn't know the system yet, and the experienced rider gets taken care of too.
The research revealed opportunities to rebuild trust and add value to ridership.
Outcomes
KCATA implemented several of the strategic directions this research pointed to — a systemwide zero-fare model, expanded high-frequency service, and a more intentional entry point into the system via the KC Streetcar. The zero-fare decision was already being considered internally, but the fare box issues and trust gaps the research surfaced made a compelling case. By 2024, ridership had recovered to roughly 12 million annual riders, near pre-pandemic levels and ahead of most peer systems. The Streetcar alone grew from around 4,000 to over 10,000 weekday riders after expansion.